

I’m a competitive person, and as competitive with myself as I am with anyone. This means that come test time I am totally focused on going further, faster and stronger than my previous attempts. Now this isn’t necessarily a good thing, not every result needs to be a PB, and there is no such thing as a failed test session. Sometimes you just have to step back and say “It is what it is”.
I had a perfect example of this yesterday when I performed an FTP test, 7 weeks after my previous one…..which I might add I wasn’t that happy with anyway. My previous test gave me an FTP value of 271 watts at 72KG, based on the results of yesterday’s test I only achieved 267 watts at 71KG. Now I know there is a glaringly obvious fact staring us in the face….I’m 1KG lighter, but I will come to that in a bit. The thing that jumped out at me is I’m 4 watts less than 7 weeks ago.
One major caveat here, I only started using a Power Meter on 1 April 2016, so there is a very small sample to work with when looking at historical data. And this probably has some significant implications for the reliability of the Performance Management Chart which I will discuss in a later post. I’m using the Polar Keo Power Pedals (left & right power) and transmitting to a Polar v650 head-unit.
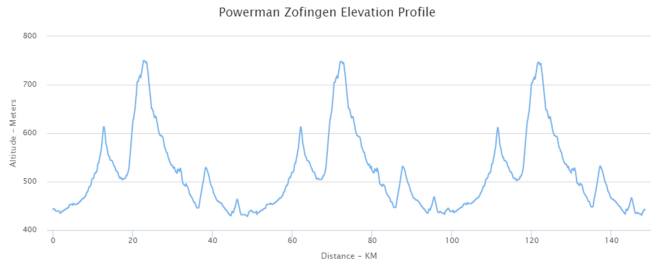
Just so you know, I am training for the Zofingen Duathlon (ITU World Long Distance Duathlon Champs), the distances being 10km run + 150km bike + 30km run. People have told me to expect it to feel like an Ironman. The cycle course in particular is a brute, with 3 significant climbs on each of the 3 laps, totaling 1800m of elevation gain. From what I understand there are a few short sharp pinches and plenty of long gradual climbing.
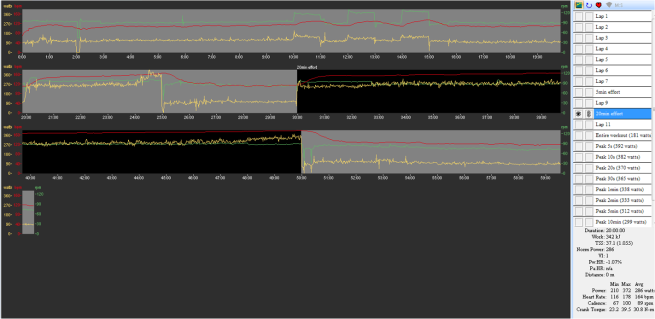
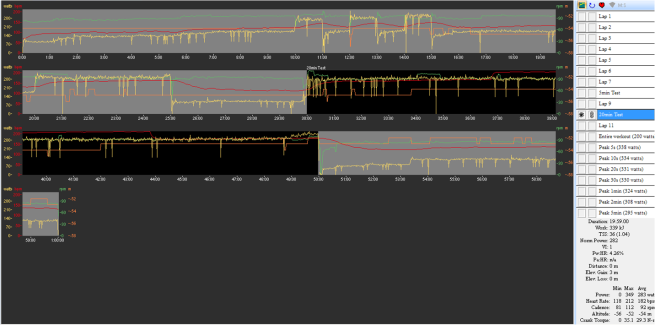
Analysing the power file from the first test on 28/4/16 shows a nicely paced effort. VI was 1.0 so there was next to no peaks and troughs in the power output (this is far easier to achieve on a trainer than on the road). There was no decoupling, in fact I probably didn’t push hard enough as the value was -1.07%, and there was an increase in output over the final 2 minutes (this is why I thought I would knock the next one out of the park, by going a bit harder from the start and really emptying the tank). Average Cadence was 89rpm and Average HR was 164bpm, with 342Kj burnt.
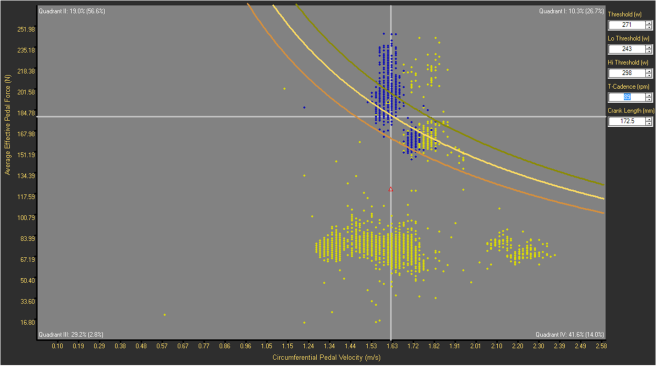
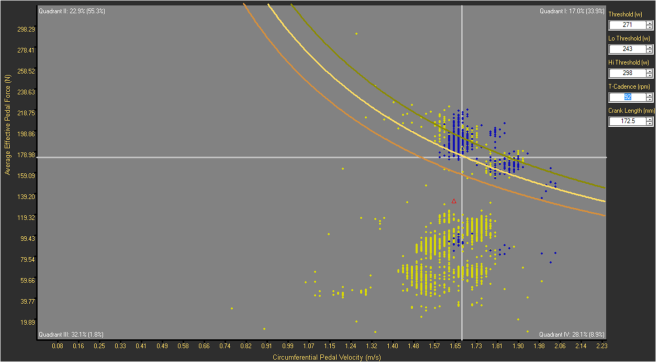
Quadrant Analysis of that effort showed 55% in Q2, which denotes High Force but Low Velocity. Much of the distribution in this quadrant was higher up the scale, and this was a bit of a concern to me. This is largely a Fast-Twitch fibre recruiting zone, and living here for long periods isn’t really that easy. So I was keen to improve on this, as I still need to have some legs to run off the bike well.
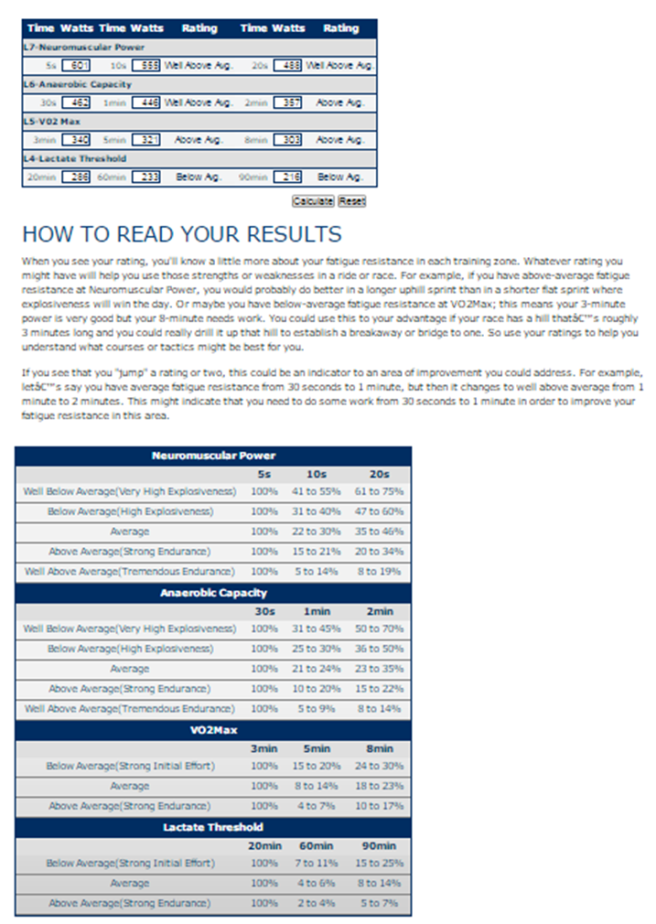
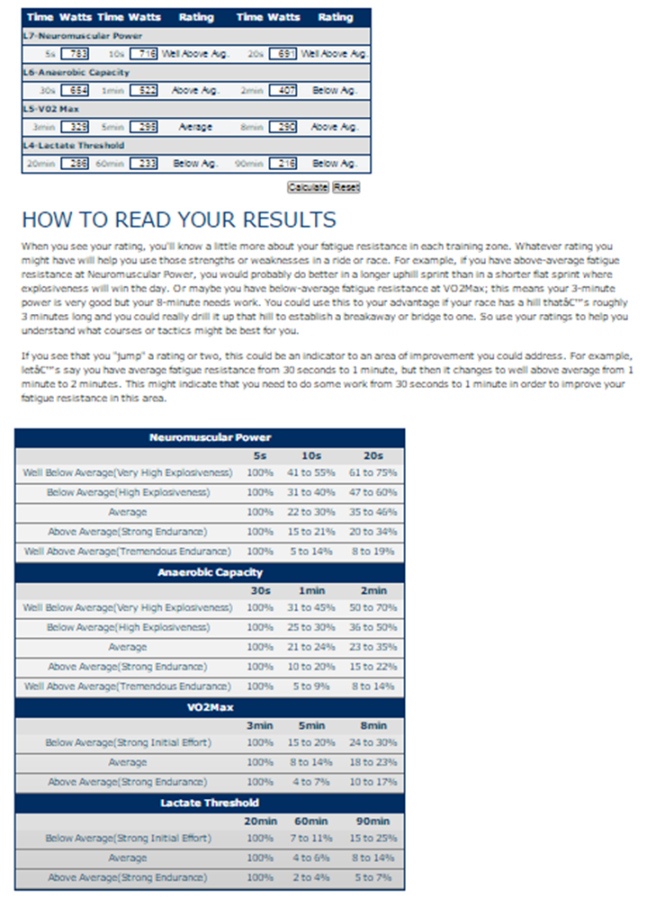
A week after the FTP test I performed a Fatigue Profile to pinpoint where my weaknesses lie, and what I need to focus on to build my FTP value while trying to achieve a higher cadence in all zones. Using Peaks Coaching’s Fatigue Profile calculator , which is an excellent tool BTW, I could see that I really had to work on my peak power in all the short duration bins, however my endurance through these was pretty good. I hadn’t done a lot of Zofingen Duathlon race specific training in the long duration bins hence they are all Below Average. So I did a bunch of sessions that were targeted on increasing force to the pedal, as well as bringing my cadence up a bit….there was a good amount of suffering going on.
So how did it all go? As you know, not quite what I was hoping for, but test results can’t be taken just on the number that is generated. It isn’t until you delve deeper into data and understand how the result came about that you start to see that things aren’t all doom and gloom.
Analysis of the second FTP test shows some interesting things. I cut it 1 second short!! Wow, I was clearly ready to end it there. I’m as disappointed in that fact as any. VI was 1.0 again, all good. I had a wee HR fart where it shot up to 210 for 7 minutes of the test, this is just something that it does occasionally, but it’s not a huge concern for me, or the Cardiologist I saw a few years ago about it. This did skew the HR graph though, so decoupling can’t be assessed accuratley, however the average HR for when it was behaving was 168bpm, so a bit higher than the previous one. I was able to lift my watts for the final minute this time, so that’s still happening, again something to work on. Average Cadence was 92rpm. 339Kj burnt through the effort, 3 less than the previous one so maybe there’s the difference with the 1 second I cut short.
Quadrant Analysis of the second FTP test showed a shift of 7.4% more in Q1, and 5.2% less in Q4, so there was a large shift to a higher cadence and higher force, but this time it’s distributed a lot lower on the scale, and scattered in a much more concentrated area. To me this suggests that cadence has improved and power distribution is more even, which has a positive impact on overall efficiency.
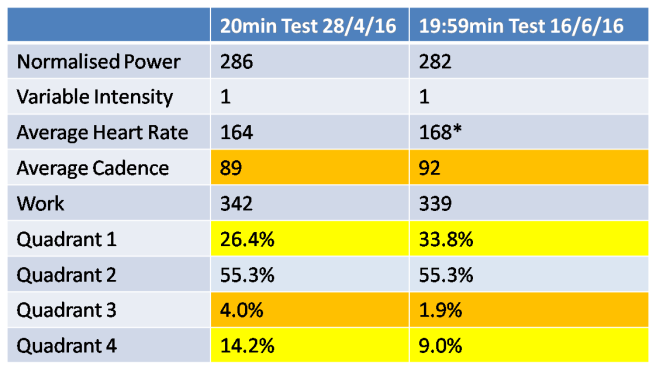
This table below should help to visualise those differences
So it was pleasing for me to see that there had been some positive changes from this 6 week period, albeit not exactly what I was hoping for. I have always known cadence to be a bit of a limiter for me (as well as force), but being able to turn a gear at a high cadence must be mastered before increasing the force that is applied to the pedal. So this progression is still in line.
My Fatigue Profile has started moving in the right direction, with higher Peak Powers for many of the bins, and I’m starting to move away from that High Endurance bias, and more to one that suits a course with plenty of short sharp climbs such as the ones I will encounter in Zofingen. I am about to shift to a race specific Build Phase so the 90 and 240min power will improve too.
I came across a really good post in the Trainer Road Blog discussing how FTP changes with cadence, and it is well worth a read. It helped me to understand some of the physiological changes that are taking place. There are a couple of good points to identify in it…
“As riders become more aerobically fit, i.e. develop a more sufficient oxygen-reliant endurance base, spinning quickly (e.g. 95rpm) keeps the force output low thereby keeping the muscle stress and fuel consumption low as well since these endurance fibers are fully up to the task of repeating their oxygen-reliant contractions almost indefinitely…….Riders lacking this aerobic fitness, and more importantly (at least at the outset) lacking efficiency, misguidedly and probably unintentionally shift their riding stress onto the anaerobic system, the power fibers, by turning a bigger gear slowly. This leads to a shift in fuel preference, a shift toward sugar, because these power fiberscan’t use oxygen, they can only use sugar. Add to this fuel shift the stress & actual damage brought on by these slower, more forceful, more taxing pedal revolutions and you have a recipe for fatigue”
So it suggests that sure it’s probably easier initially to sit and grind away at a big gear, and in the early stages you will go pretty fast. But eventually your fuel sources (sugar) are going to run dry and you will be left struggling. Developing a lighter, more efficient spin will prolong your endurance and make your riding more enjoyable. Learning how to spin a gear in all zones is probably a good speed skill to develop.
The trade off for increasing your cadence is that the force generated and applied to the pedal is less because the workload has been taken away from your powerful muscles and is now being driven by your cardiovascular system, hence the slight increase in average Heart Rate you saw in my results.
The issue of power:weight ratio needs to be discussed too, as this is where a lot of people come unstuck. I will leave you with one thing to consider…..body weight on 28/4/16 was 72kg, FTP was calculated as 271w, therefore power:weight ratio was 3.76w/kg. Bodyweight on 16/6/16 was 71kg, FTP was calculated as 267w, therefore power:weight ratio is 3.76w/kg.
So was it really a fail? Let’s recap…
Yes, my FTP is less. But average cadence has increased, Quadrant Analysis is more suited to the event I’m training for, power:weight ratio hasn’t changed. I’ll call it a relative success for now, but I am determined to make that next FTP value to be higher than what it currently is.
You may have noticed there are a couple of things I have omitted from the discussion, and those are the timing of the test and the state of fatigue going into it. I will discuss these in the next post as I have some interesting thoughts around those.
If you are interested in employing a Triathlon Coach for your next key event feel free to get in touch with Foot Traffic Coaching. We have various levels of Training Plans and have the experience to help guide you to your goals. We also have a free public Facebook Group (Traffic Jam) where we discuss all things endurance sports. Don’t forget to like our Foot Traffic Endurance Sport Coaching Facebook page so you can keep up to date with what’s happening with our athletes around the world.
